Standard benchmarks for EM
Armed with an understanding of the CoreMark ⇒ EM•Mark transformation, you'll further appreciate the significance of the EM benchmarks presented below. While CoreMark focuses heavily on measuring CPU performance, EM•Mark takes a more balanced approach that also considers program image size, active power consumption, and overall energy efficiency.
With an emphasis on maximizing execution time, CoreMark programs overwhelmingly employ the most aggressive "optimize-for-speed" options when compiling the benchmark sources for a particular MCU – resulting in excessively large program images.
By way of contrast, EM•Mark starts from the premise that minimizing program size when targeting resource-constrained MCUs trumps other performance factors. Said another way, most embedded firmware developers in practice will usually choose the most aggressive "optimize-for-size" option when compiling their code.
Texas Instruments reports a score of 2.1 CoreMarks / MHz for their CC2340R5 wireless MCU, which features a 48 MHz Cortex-M0+ CPU. TI used the IAR C/C++ compiler [ v9.32.2 ] to generate an ~18 K program image, optimized for high-speed with no size constraints.
The legacy CoreMark results we'll report below used TI's LLVM-based Arm compiler [ v2.1.3 ] with its "optimize-for-size" [ -Oz ] option. To satisfy our curiousity, building the same CoreMark program using the compiler's "optimize-for-speed" [ -Os ] option yielded comparable results to those reported with IAR. (1)
- We'll leave adding GCC into the mix as an exercise for the reader; suffice it to say the GCC does not win the race !!
All of the EM•Mark results reported below use the ti.cc23xx distro bundle delivered with the EM-SDK plus the following pair of Setups when building program images: (1)
- Here, too, we'll leave experimentation with GCC-based Setups available for this target hardware as an extra-credit project.
ti.cc23xx/segger |
CLANG / LLVM 14.0, optimized for space, code + consts in Flash |
ti.cc23xx/segger_sram |
CLANG / LLVM 14.0, optimized for space, code + consts in SRAM |
TBD – open for suggestions
TBD – open for suggestions
Program size
Much like the legacy CoreMark C code, the ActiveRunnerP EM program performs multiple iterations of the benchmark algorithms and displays results when finished:
Recalling the central role played by the CoreBench module in the EM•Mark high-level design, the implementation of its setup and run functions dominate the code / data sizes of the ActiveRunnerP program image:
Execution time
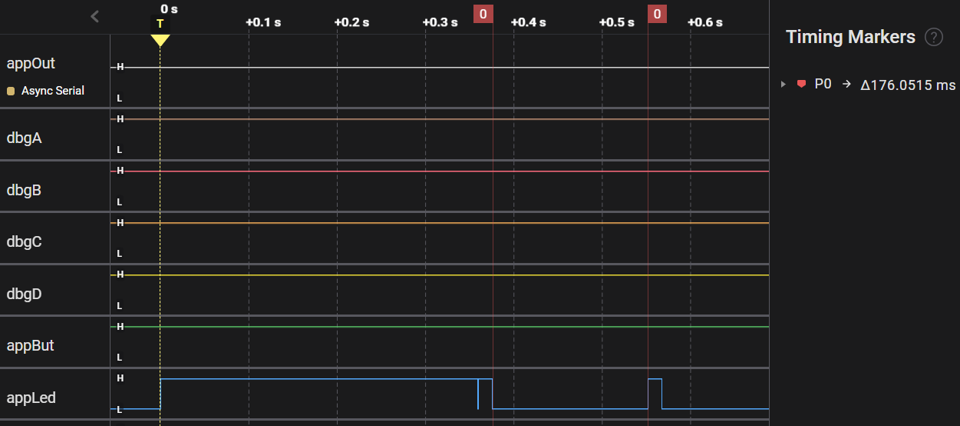
We've used a Saleae Logic Analyzer to capture logic traces of the legacy CoreMark and ActiveRunnerP programs executing ten iterations of the benchmark. To help measure execution time, both programs blink appLed for 250 ms before / after the main benchmark loop:
Active power
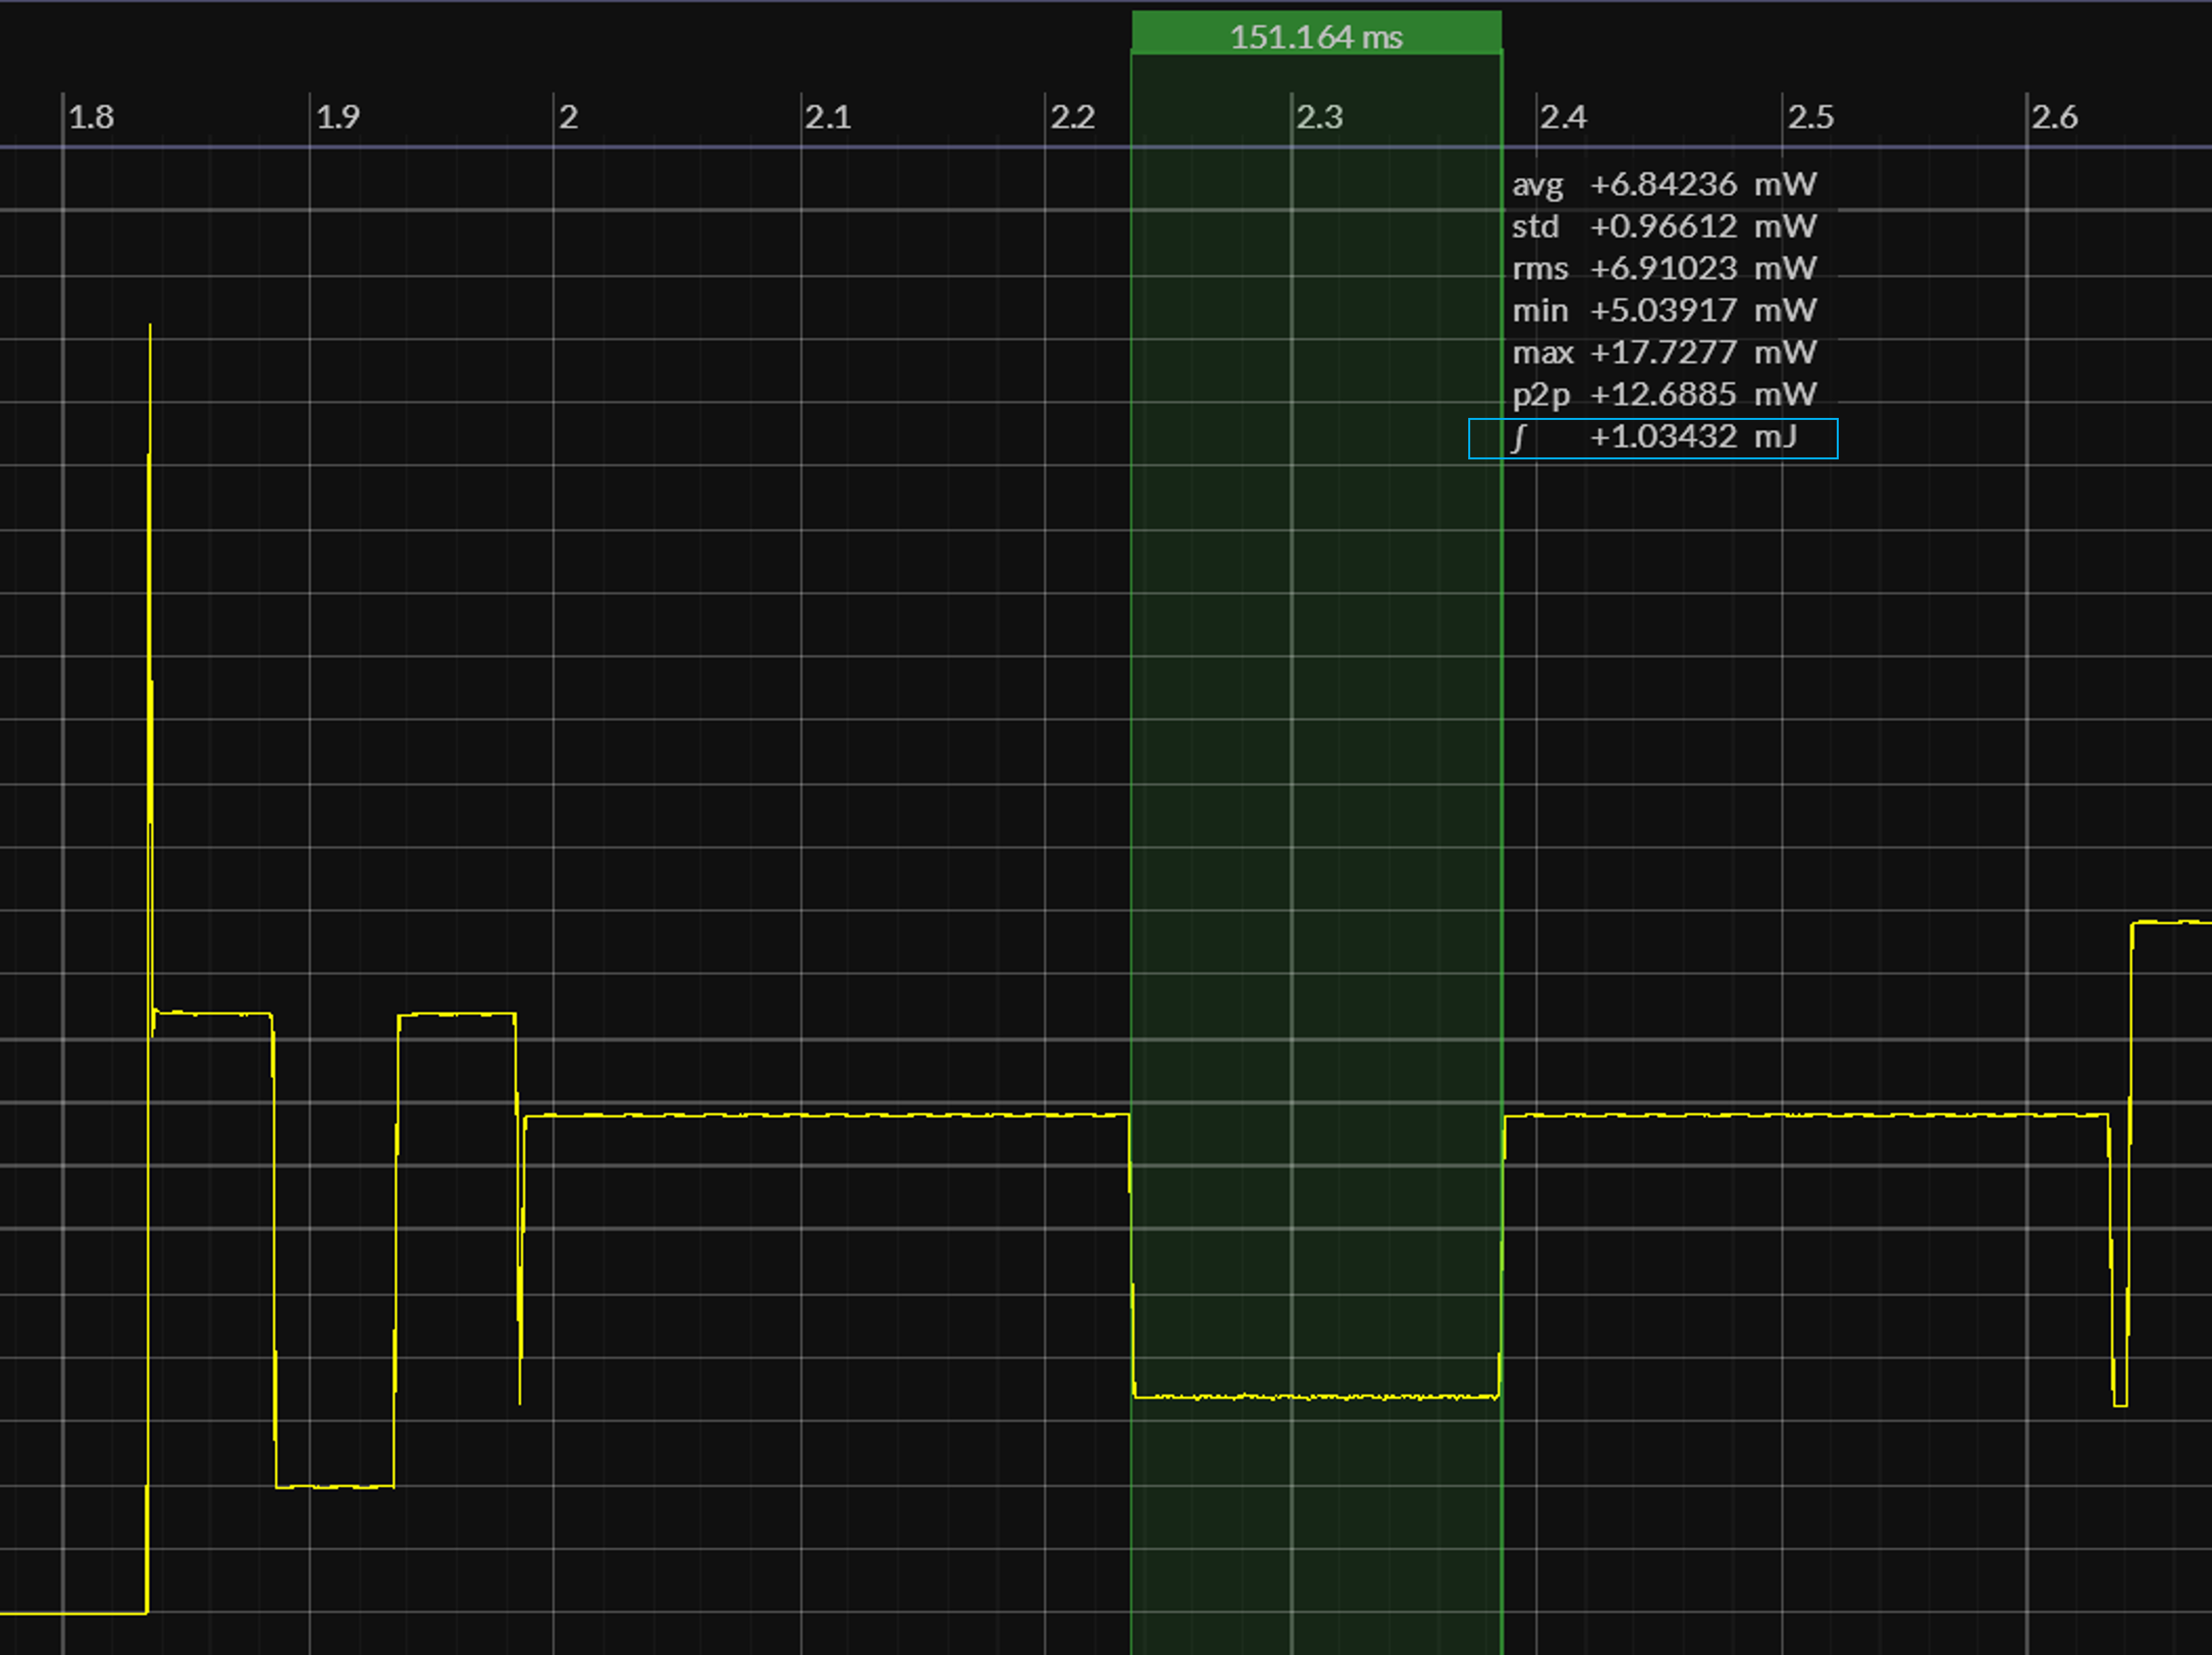
We've used a Joulescope JS220 to capture power profiles of legacy CoreMark and ActiveRunnerP executing ten iterations of the benchmark. To help measure power consumption, both programs blink appLed for 250 ms before / after the main benchmark loop:
Energy efficiency
Applications targeting resource-constrained (ultra-low-power) MCUs often spend most of their time in deep-sleep – awakening at rates from once-per-second down to once-per-day, and actively executing for time windows measured in just milliseconds.
The CPU-centric nature of legacy CoreMark (and hence ActiveRunnerP) doesn't necessarily reflect "real-world" duty-cycled applications targeting ULP MCUs, where maximizing energy efficiency becomes paramount.
ULPMark® benchmark suite
In addition to legacy CoreMark, the EEMBC organization offers ULPMark – a benchmark suite that quantifies many aspects of ultra-low-power MCUs. One of the profiles in the suite in fact measures active power consumption, using CoreMark as the workload; other profiles quantify the true energy cost of deep-sleep.
Unlike CoreMark, however, ULPMark requires a paid license to access its source code — an obstacle for purely inquisitive engineers working with ULP MCUs. EM•Mark attempts to fill this niche with a complementary pair of portable programs for benchmarking code size and execution time, as well as power consumption.
To that end, EM•Mark also incorporates the SleepyRunnerP program – which executes the same underlying benchmark algorithms as ActiveRunnerP, but in a very different setting:
Here too, SleepyRunnerP calls CoreBench.setup at startup; but instead of the "main loop" seen earlier in ActiveRunnerP, we now make a single call to CoreBench.run just once-per-second. Relying only on modules found in the em.core bundle [ FiberMgr, TickerMgr ], SleepyRunnerP can execute on any target MCU for which an em$distro package exists. (1)
- Review the material in Tour 12 – cyclic tickers if necessary
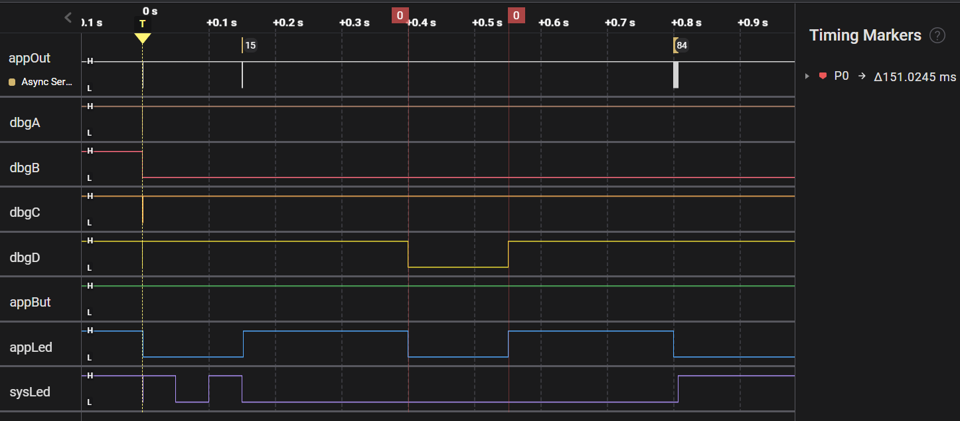
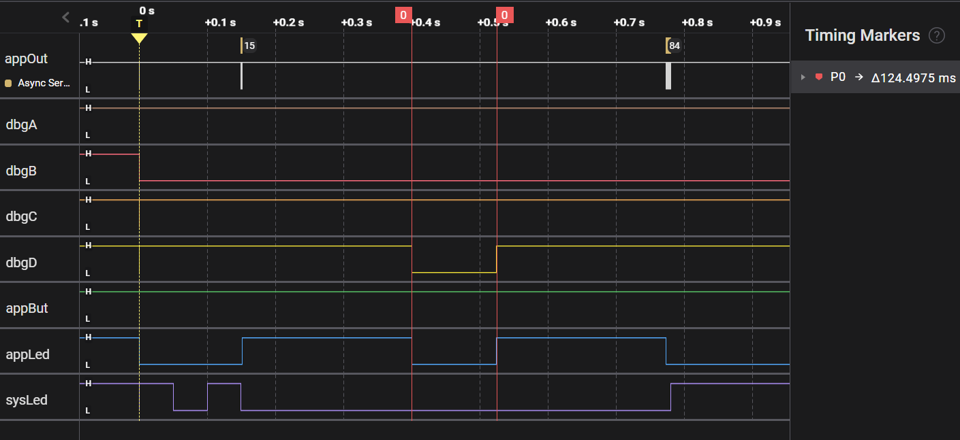
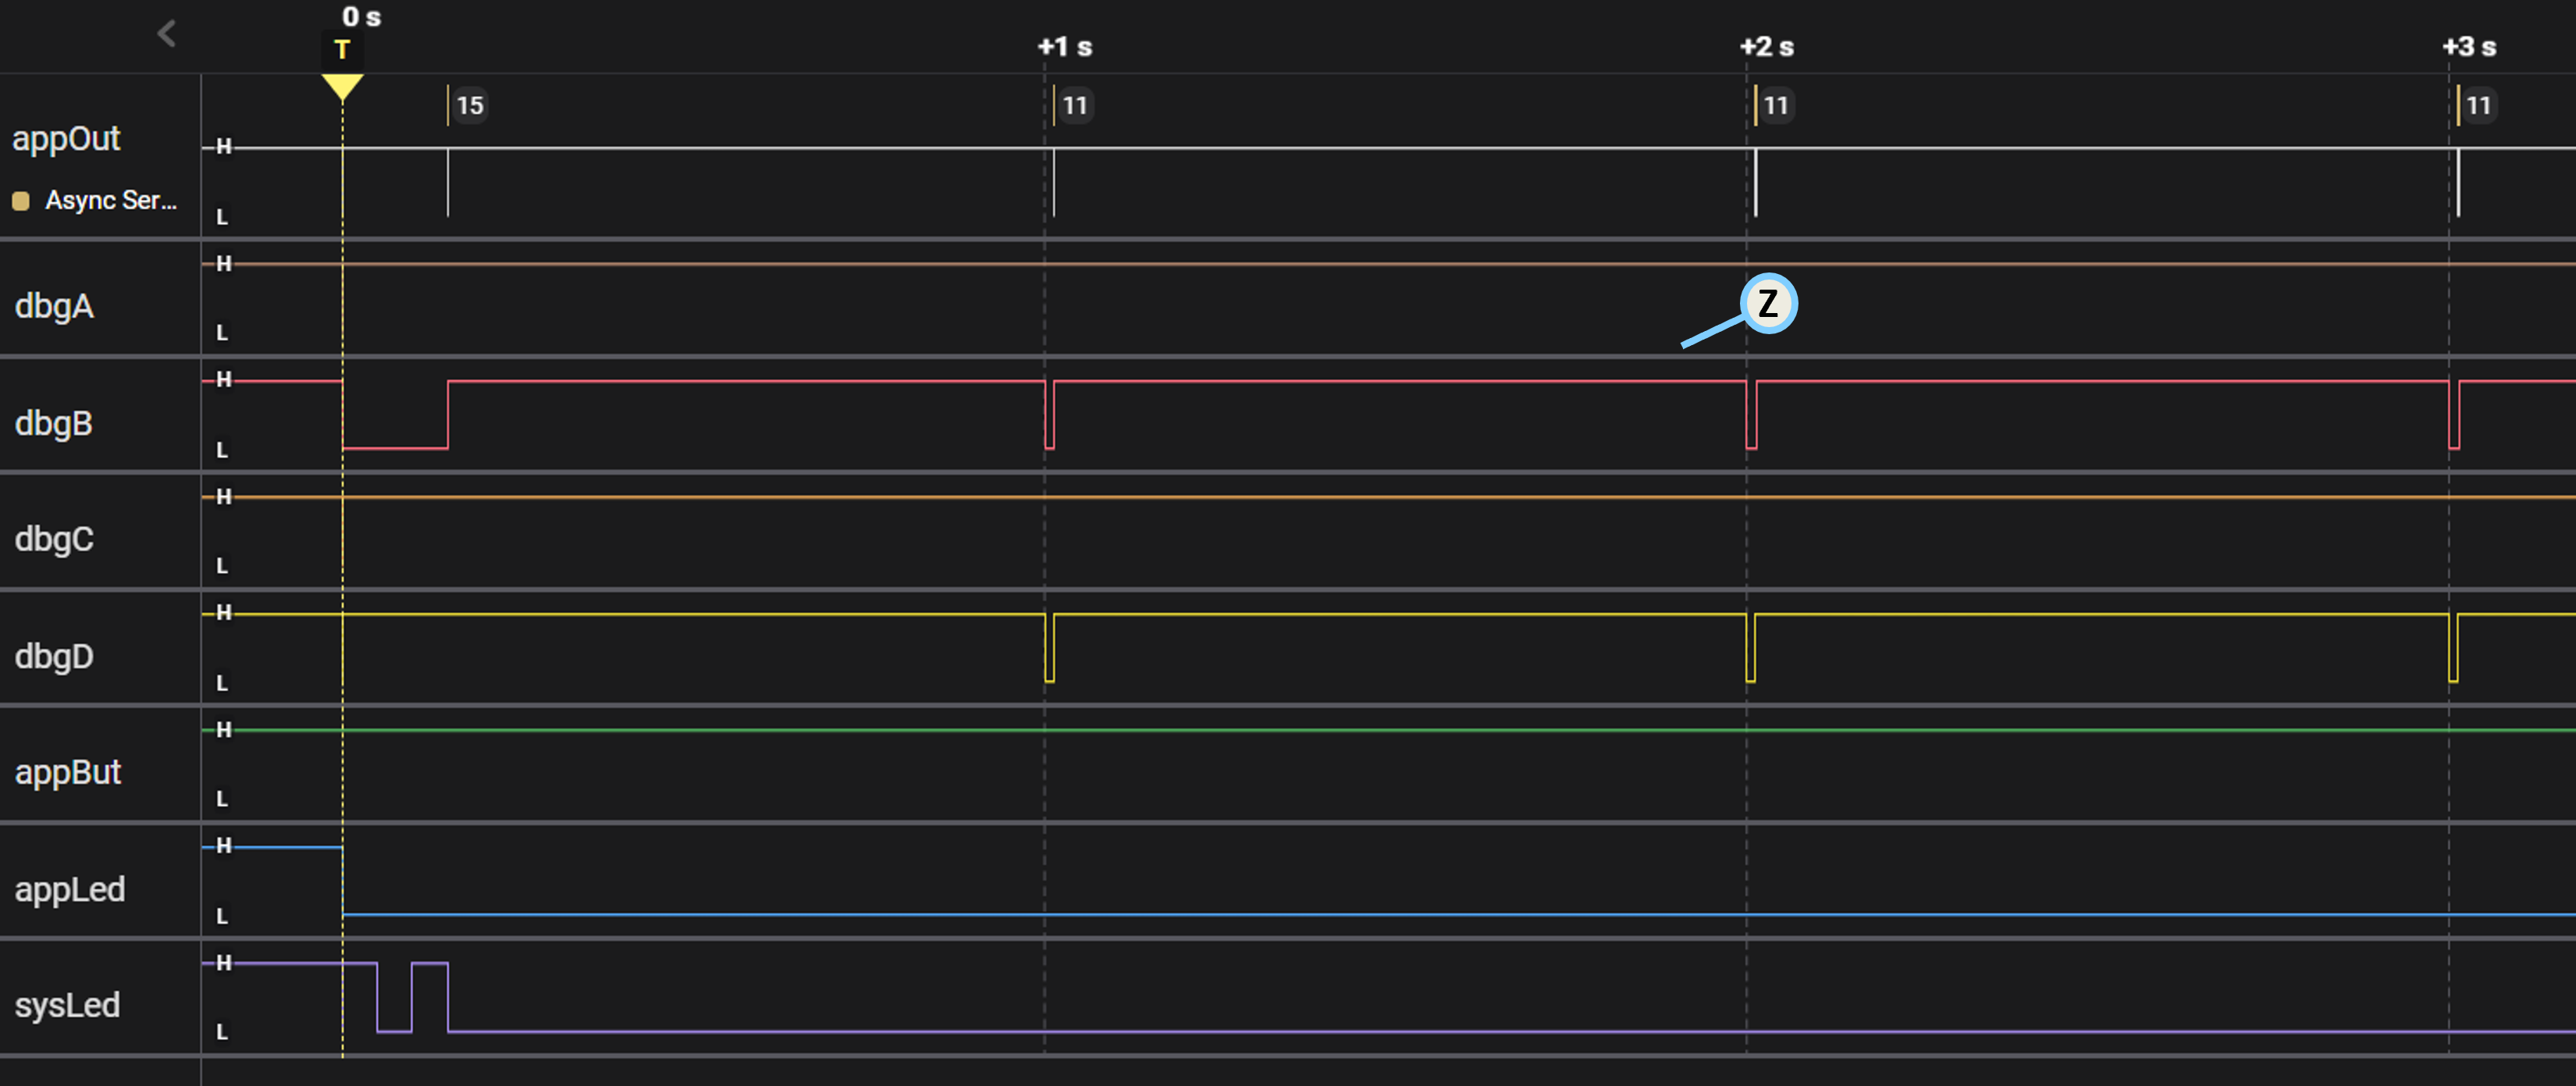
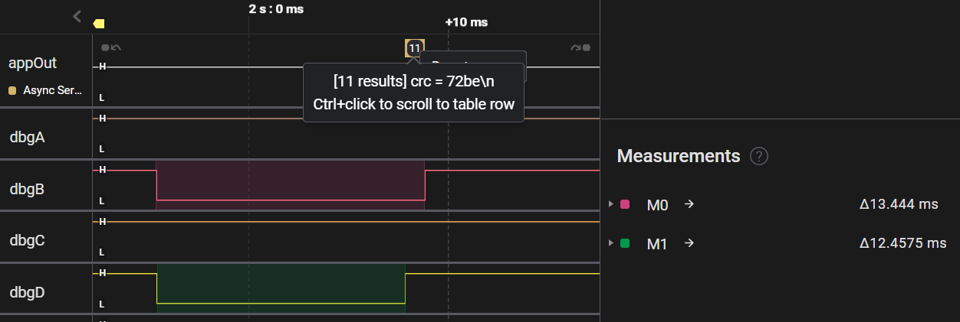
The following sets of Saleae logic-captures first show SleepyRunner awakening once-per-second, and then zoom-in to view the execution time of a single active cycle:
Note that measurement M0 reflects the total active time as framed by dbgB (managed automatically by EM), whereas measurement M1 reflects the actual benchmark interval between the dbgD toggles seen earlier in SleepyRunnerP. Also note that the latter measurement does not include the time to format / output the "crc = 72be\n" character string.
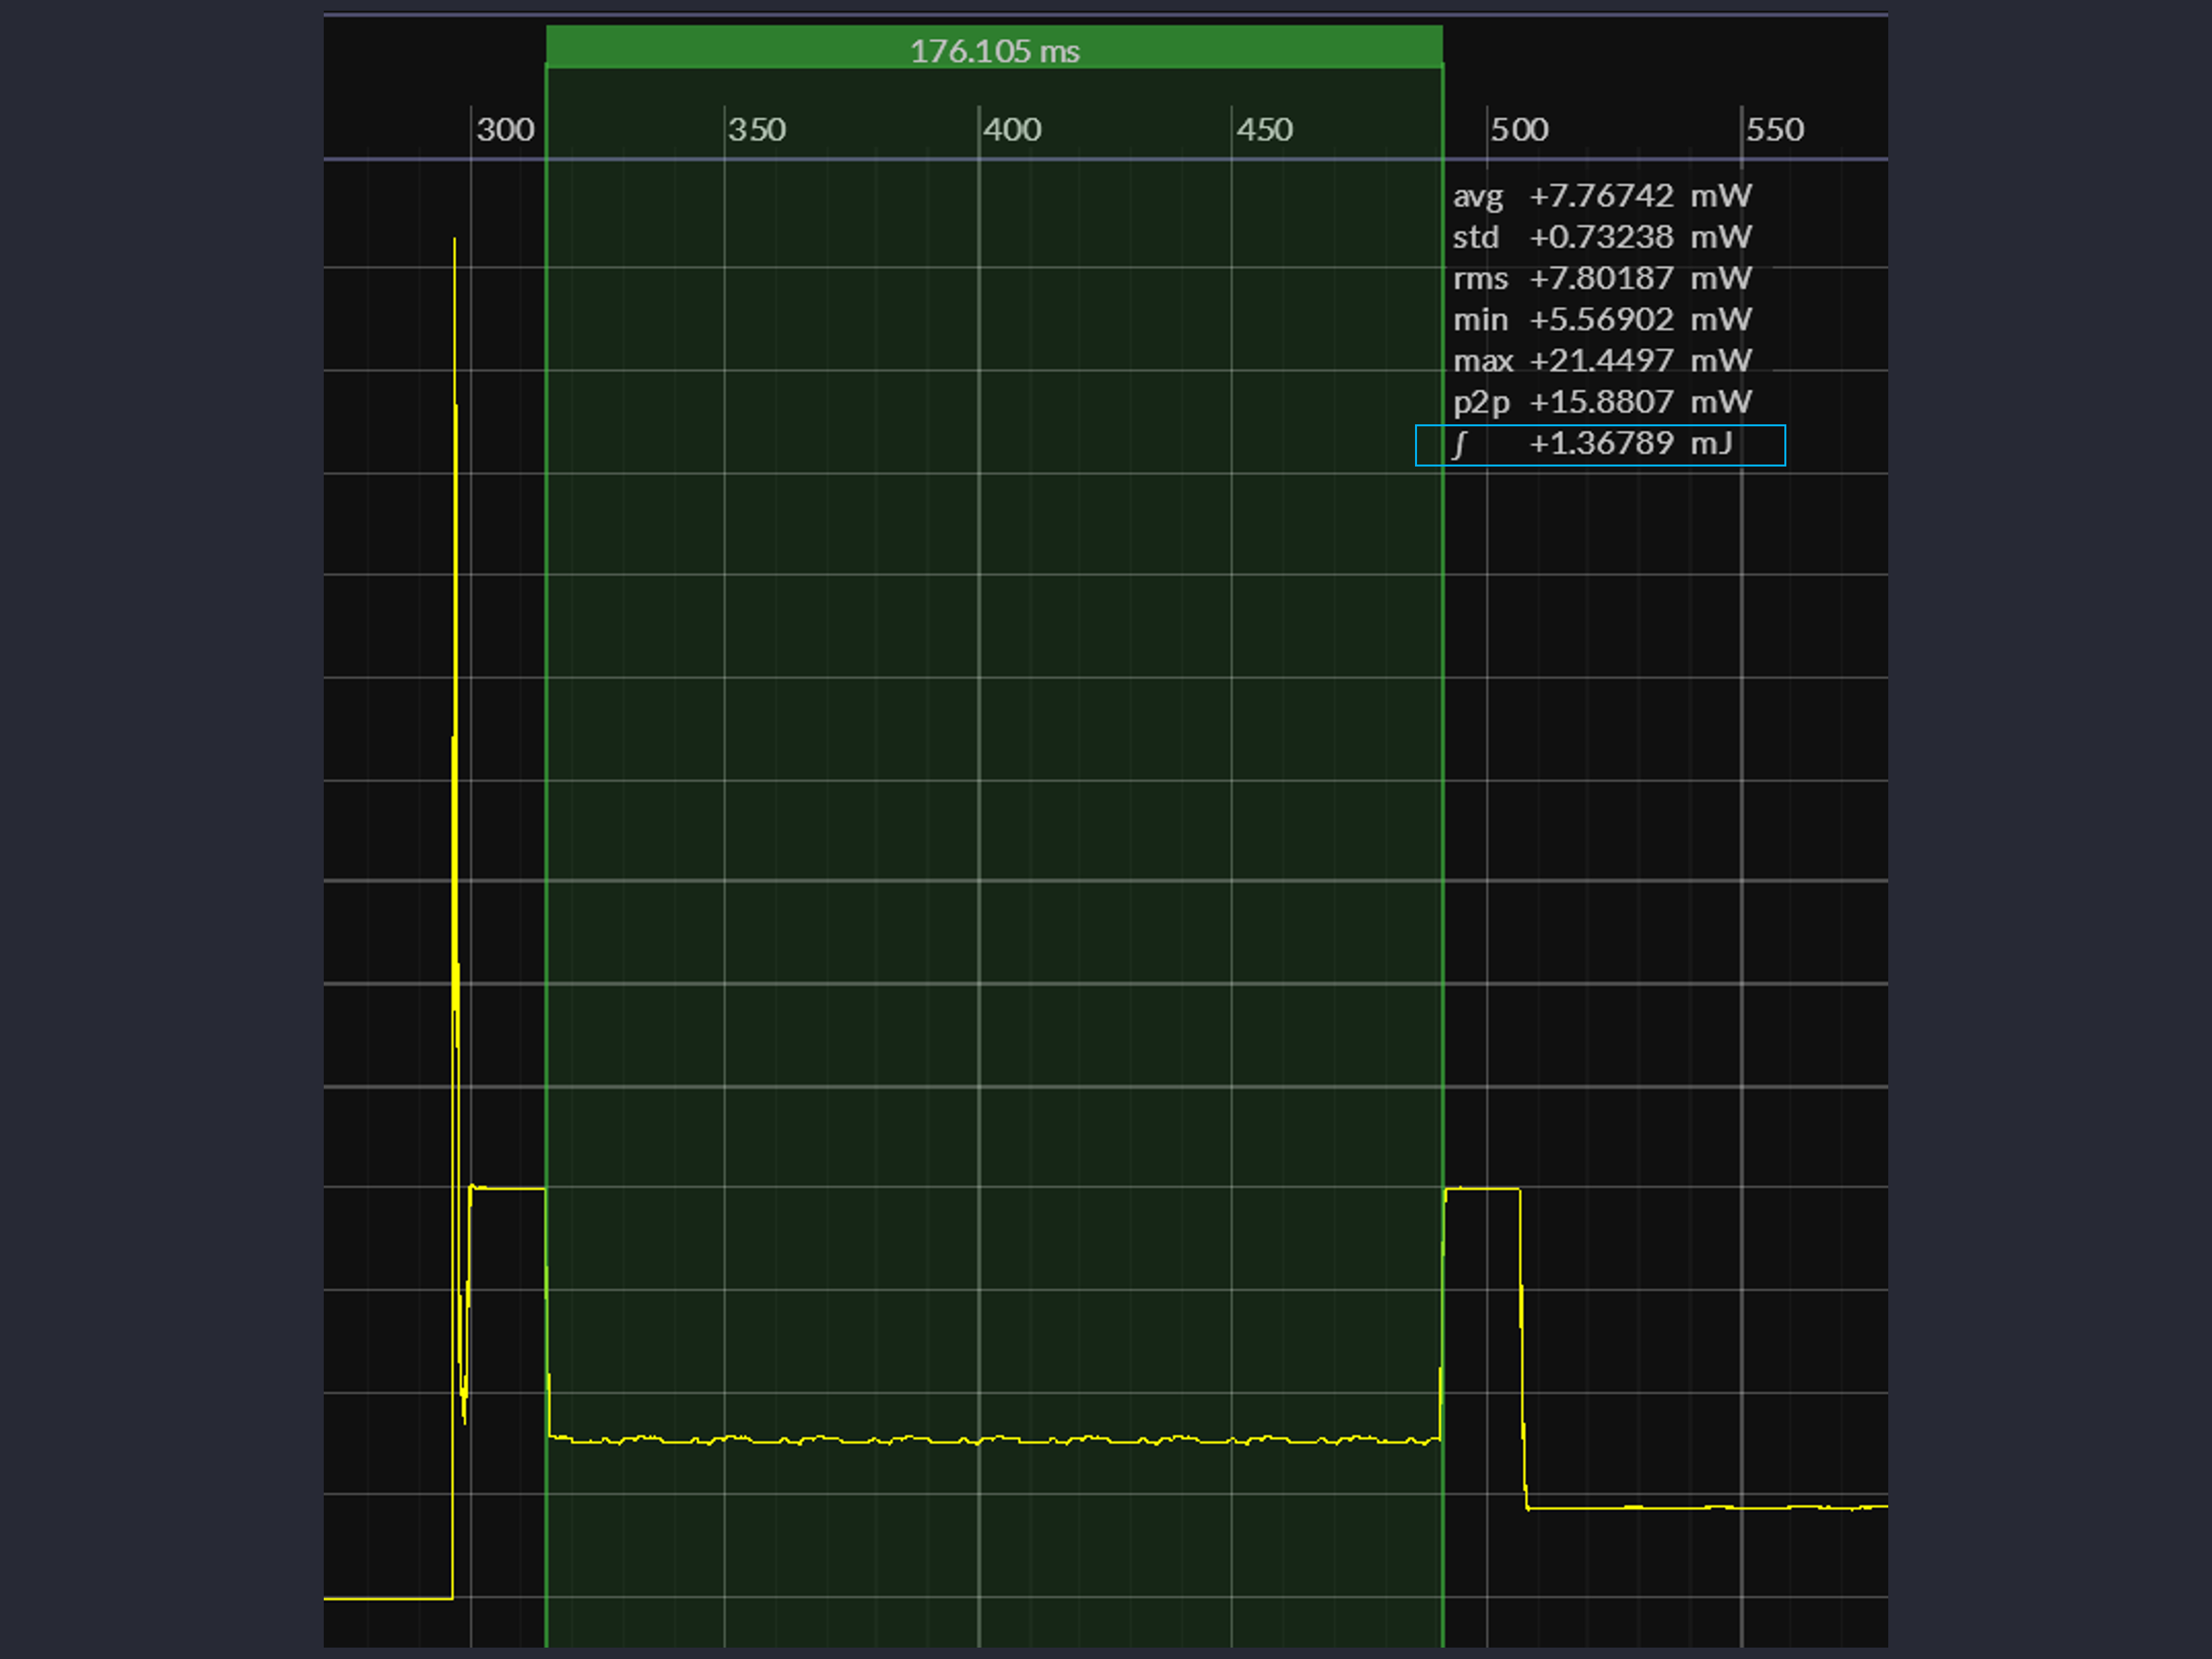
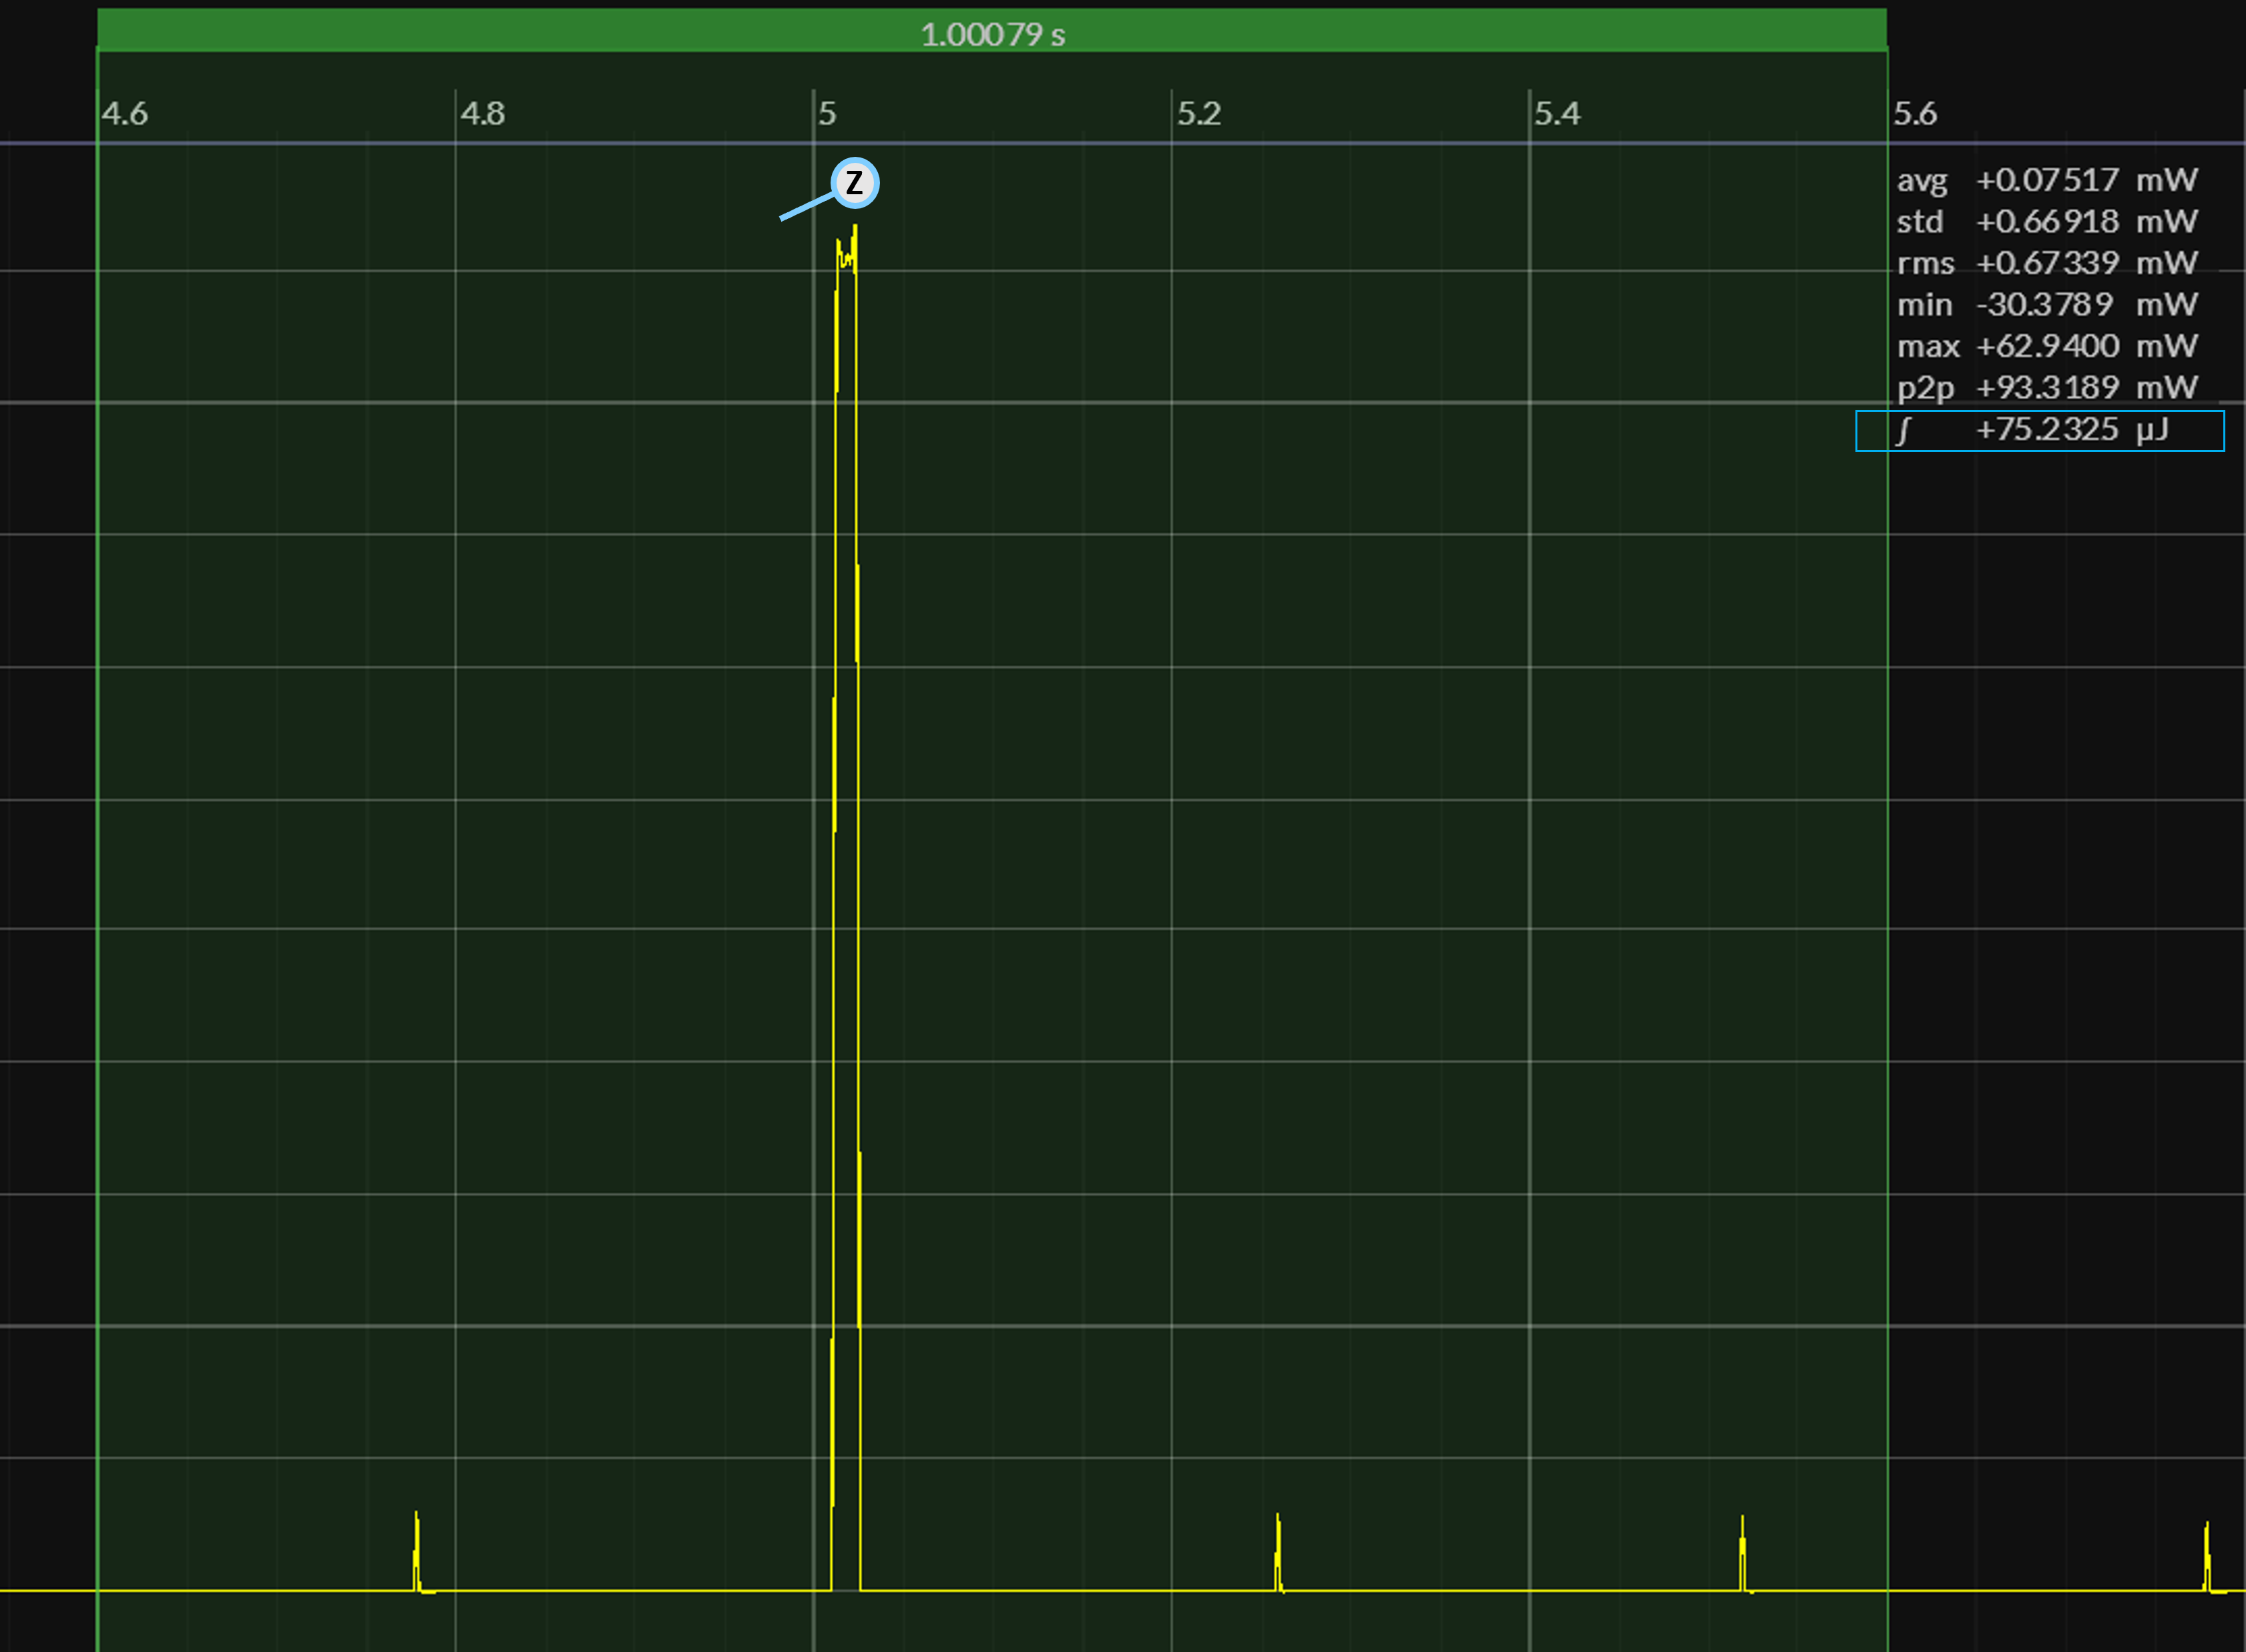
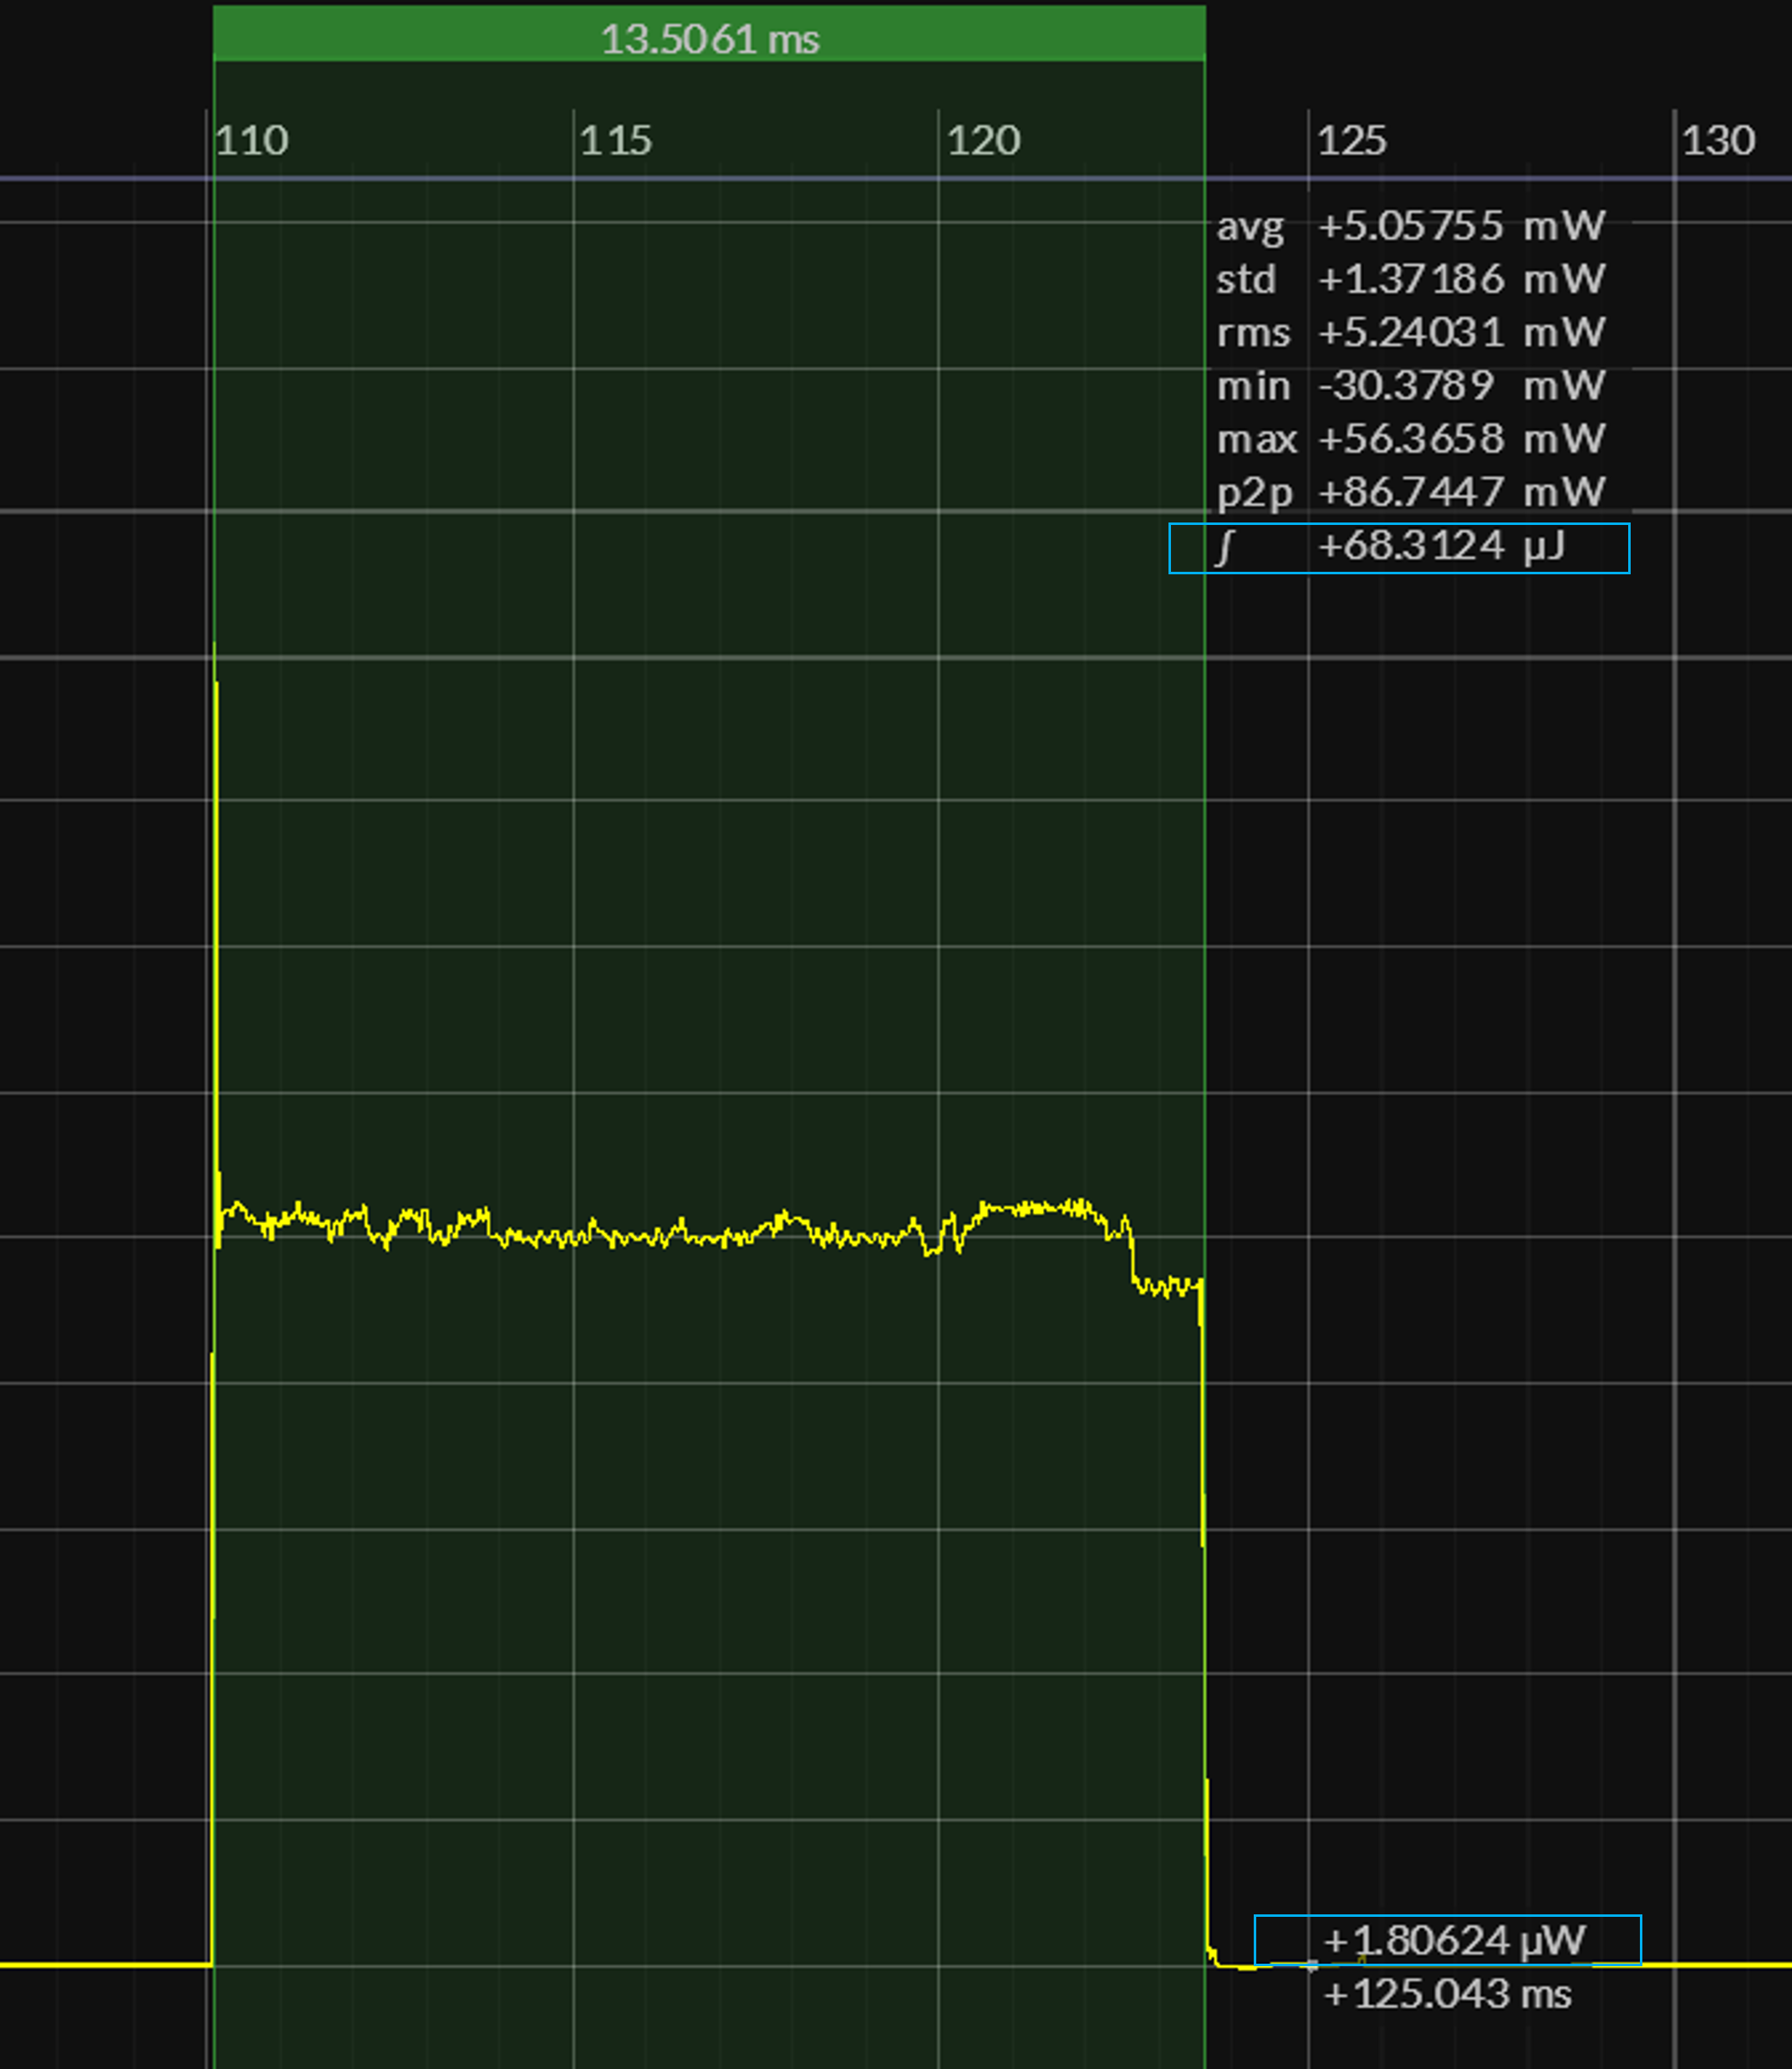
The following sets of Joulescope power-captures report the total amount of energy consumed over a one-second interval, as well as the amount of energy consumed when the SleepyRunnerP program awakens and executes a single iteration of the benchmark:
As expected, a single call to the CoreBench.run function takes only milliseconds to execute and yet consumes most of the energy over the one-second cycle.
General observations
Improvements in EM•Mark program size and execution time compared with legacy CoreMark hopefully supports EM's claim of higher-level programming and higher-levels of performance .
Building EM•Mark with the most aggressive "optimize-for-size" options passed to the underlying C/C++ compiler reflects the reality of targeting resource-constrained MCUs.
Placing runtime code and constants into SRAM (versus Flash) not only improves execution time but also reduces active power consumption — a corrolary of optimizing for program size.
While ActiveRunnerP maintains the same focus as legacy CoreMark (inviting side-by-side comparison), the SleepyRunnerP benchmark more accurately quantifies the energy efficiency of ULP MCUs.

